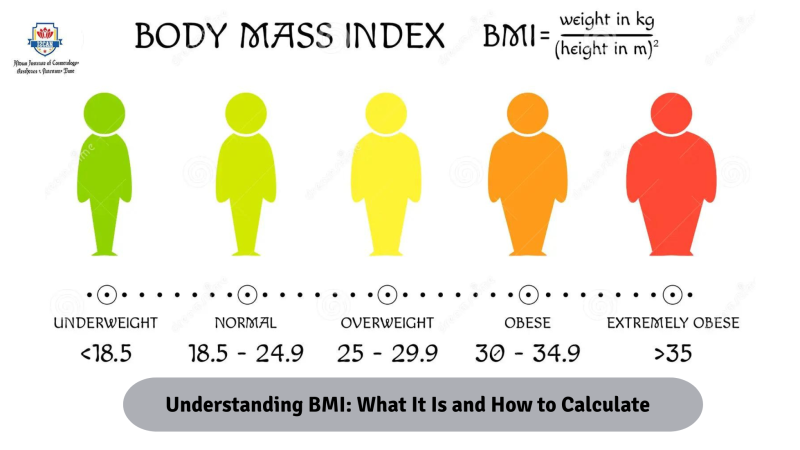
Body Mass Index (BMI) is a screening number — not a diagnosis — that estimates whether your weight falls in a range associated with lower health risk. It’s the single most-used tool in the world for a first-pass weight check, precisely because it only needs two numbers you already know:
Your Height and Your Weight.
This guide is built to do two things: give you an accurate BMI reading, and help you understand what that reading actually means for you — including where the standard chart gets it wrong for Indian and Asian bodies, which most BMI guides don’t mention at all.
Reviewed against WHO classification standards, the ICMR–INDIACO Consensus Statement for Asian Indians, and clinical guidance from NIH/NHLBI and Cleveland Clinic. Clinical Nutrition experts at I2CAN fact-checked this article for accuracy.
Table of Contents
Calculate Your BMI
BMI Calculator
Enter your details and click Calculate
BMI = -- kg/m² ( )
- Healthy BMI range18.5 kg/m² – 25 kg/m²
- Healthy weight for the height–
- BMI Prime–
- Ponderal Index–
BMI is a general screening tool and doesn't account for muscle mass, age, or body composition individually. For a full assessment, consult a nutrition or healthcare professional. Learn more about BMI →
So the number isn’t left to interpret itself: “A BMI of 18.5–24.9 is generally considered a healthy range. If you’re of South Asian or Indian descent, the healthy range is narrower — see why.”
What Your BMI Category Means
BMI results are sorted into four broad WHO-defined categories. Find your range below, then read what it means before you read what to do about it — the “what to do” section further down is more useful once you know where you stand.
| BMI Range (kg/m²) | Category | What It Generally Indicates |
|---|---|---|
| Below 18.5 | Underweight | May signal inadequate nutrition; worth checking in with a doctor, especially if unintentional. |
| 18.5–24.9 | Healthy weight | Associated with the lowest average risk of weight-related health issues. |
| 25.0–29.9 | Overweight | Increased risk for cardiovascular and metabolic conditions; often reversible with lifestyle changes. |
| 30.0–34.9 | Obesity (Class 1) | Moderate risk; a good point to involve a healthcare or nutrition professional. |
| 35.0–39.9 | Obesity (Class 2) | Severe risk; structured medical or clinical nutrition support is recommended. |
| 40.0 and above | Obesity (Class 3) | Very high risk; typically requires medical management alongside lifestyle change. |
A note before you react to your number: these are population-level categories, built from large-group health data — they describe statistical risk trends, not a verdict on any one person. Two people can share a BMI of 27 and have completely different health profiles depending on muscle mass, fat distribution, age, and ethnicity. Keep reading — the next two sections explain exactly why, and what’s actually worth checking alongside your BMI.
Important: If You're Indian or Asian, Read This First
This is the part most BMI guides skip entirely — and it matters. The standard BMI chart above was developed and validated primarily on European body-composition data. Research consistently shows that Indian and other South Asian bodies carry more visceral (organ-surrounding) fat and face higher diabetes and cardiovascular risk at a lower BMI than Western populations do, at the same number on the scale. This is sometimes called the “thin-fat” phenotype — a normal-looking BMI that still carries elevated metabolic risk.
Because of this, WHO’s Asia-Pacific guidance and India’s own clinical consensus (the Consensus Statement for Asian Indians) recommend lower cut-offs:
| BMI Range (kg/m²) | Standard/WHO Category | Asian Indian Category |
|---|---|---|
| Below 18.5 | Underweight | Underweight |
| 18.5 – 22.9 | Healthy weight | Healthy weight |
| 23.0 – 24.9 | Healthy weight | Overweight |
| 25.0 – 29.9 | Overweight | Obese |
| 30.0 and above | Obesity (Class 1+) | Obese (advanced) |
In plain terms: a BMI of 24 reads as “healthy weight” on the standard global chart, but under the Indian consensus guideline, it already falls in the overweight range. This isn’t a stricter standard for the sake of it — it reflects that Indian populations develop insulin resistance and type 2 diabetes at meaningfully lower BMI levels than the WHO’s original 25/30 cut-offs would suggest.
If you’re of Indian or South Asian descent, it’s worth mentally re-checking your result against this table rather than the general one above — particularly if your number falls between 23 and 27, where the two systems disagree most.
This guidance also generally applies to waist circumference: for Asian Indian adults, a waist above 90 cm (men) or 80 cm (women) is considered a marker of central obesity, again lower than the global 102 cm / 88 cm thresholds used elsewhere. More on why waist size matters in the Beyond BMI section below.
How to Calculate BMI Manually
The calculator above will do this for you instantly, but it helps to understand the math — especially if you want to track changes yourself over time without re-opening a tool every time.
Metric Formula
BMI = Weight (kg) ÷ [Height (m)]²
Worked example: A person weighing 70 kg at 1.75 m tall: 70 ÷ (1.75 × 1.75) = 70 ÷ 3.0625 = 22.9 → Healthy weight
Imperial Formula
BMI = [Weight (lb) ÷ Height² (in²)] × 703
Worked example: A person weighing 180 lb at 5’5″ (65 inches) tall: (180 ÷ 65²) × 703 = (180 ÷ 4,225) × 703 = 29.9 → Overweight (just under the obesity threshold)
Two Mistakes That Throw Off a Manual Calculation
Mixing units. If you measure height in centimetres, convert to metres first (÷100) before squaring — squaring centimetres directly gives a BMI that’s off by a factor of 10,000.
Forgetting to square the height. This is the single most common manual error — dividing weight by height once instead of height-squared inflates the result significantly.
What BMI Gets Right
Before the limitations — because BMI does earn its place as a first-pass tool — here’s why doctors, dietitians, and public health bodies still rely on it:
It costs nothing and takes seconds. No lab test, no special equipment — just a scale and a tape measure.
It correlates well at a population level. Across large groups, higher BMI does track with higher average risk of conditions like heart disease, type 2 diabetes, and high blood pressure.
It’s the shared language of screening. Because it’s standardized, a BMI reading means roughly the same thing whether it’s calculated in a clinic in Pune or a hospital in London — which makes it genuinely useful for public health tracking and initial risk triage.
It’s a reasonable starting point for a conversation, not the final word — which is exactly how a good doctor or nutritionist uses it.
What BMI Gets Wrong (Its Real Limitations)
BMI’s biggest flaw is structural: it uses only two numbers, so it cannot see composition, distribution, age, or ethnicity — all of which affect what a given number actually means for a real body.
It Can’t Tell Muscle From Fat
BMI weighs muscle and fat identically. A visibly fit person with significant muscle mass can register as “overweight” or even “obese” by BMI alone, while someone with low muscle and higher body fat can land in the “healthy” range despite a less favourable health profile. This is the single most common criticism of BMI, and it’s a fair one.
It Ignores Where Fat Is Stored
Fat around the abdomen and organs (visceral fat) carries meaningfully more health risk than fat stored elsewhere on the body (subcutaneous fat) — but BMI treats a kilogram of each identically. Two people with the same BMI can have very different actual risk profiles depending on where that weight sits.
It Wasn’t Built With Every Population in Mind
As covered above, the original BMI cut-offs were validated mainly on European data. Age, sex, and ethnicity all shift what a “healthy” number should be — which is exactly why the Asian and Indian-specific table above exists.
It Doesn’t Adjust for Age Automatically
The same BMI category is applied across most of adulthood, even though body composition naturally shifts with age — older adults tend to carry proportionally more fat and less muscle at the same BMI as younger adults. (More in the Older Adults section.)
Who Should Be Especially Cautious About Reading BMI at Face Value
➡️ Athletes, bodybuilders, and anyone with significant muscle mass
➡️ Children and teenagers (they need age/sex-specific percentile charts, not adult categories — see below)
➡️ Pregnant women
➡️ Adults over 65
➡️ Anyone with a medical condition causing muscle loss (atrophy) or fluid retention
Which Measurement Should You Actually Trust?
The honest answer: no single number tells the whole story — but some pair better with BMI than others. Here’s how the main options stack up, so you know what’s worth adding to the picture.
| Measurement | What It Actually Tells You | Best Used When |
|---|---|---|
| BMI | Overall weight-for-height ratio | A fast, free first-pass check |
| Waist circumference | How much fat is stored centrally/viscerally (Indian thresholds: ≥90 cm men, ≥80 cm women) | Your BMI is borderline, or you want a check on abdominal risk specifically |
| Waist-to-hip ratio | Fat distribution pattern (apple vs. pear shape) | Understanding your body's risk shape, not just size |
| Body fat percentage | Actual proportion of fat vs. lean mass | You're muscular, an athlete, or BMI feels like it's misreading you |
|
Blood markers (blood pressure, blood sugar, cholesterol) | Real, current metabolic health — not an estimate | The most clinically meaningful check, done via a doctor |
The practical takeaway: if your BMI and your waist circumference agree, that’s a reasonably strong signal either way. If they disagree — say, a “normal” BMI with a waist size above the Indian threshold — the waist measurement is generally the more trustworthy flag, since it more directly reflects the visceral fat that drives most weight-related health risk.
What to Do With Your Result
This is the section most BMI pages skip — the number is only useful if you know what a sensible next step looks like.
If you’re in the underweight range: Don’t assume more food is automatically the fix — unintentional weight loss or a persistently low BMI is worth a conversation with a doctor, since it can point to nutritional gaps or an underlying condition worth ruling out.
If you’re in the healthy range: Good news — but “healthy BMI” isn’t a finish line. It’s still worth tracking your number occasionally over time (BMI trends matter more than any single reading) and pairing it with basic activity and nutrition habits.
If you’re in the overweight range: This is often the most actionable zone — small, sustained changes to activity and eating patterns tend to have an outsized effect here, well before intervention becomes urgent. Worth checking your waist circumference too, using the table above.
If you’re in an obesity category: This is a genuinely good point to loop in a professional — a GP for a general health check, or a clinical nutritionist/dietitian for a structured, personalised plan rather than generic advice. Structured support consistently outperforms self-directed changes at this stage.
Across every category: BMI trend over months matters far more than any single reading. If you’re tracking it, revisit the same time of day, similar clothing, and the same scale where possible, so the numbers are actually comparable to each other.
What to Do With Your Result
BMI interpretation genuinely isn’t one-size-fits-all. A handful of groups need a different lens entirely:
Children and adolescents: Adult BMI categories don’t apply. Growing bodies are assessed using age- and sex-specific percentile charts instead of fixed numeric cut-offs, since a “healthy” BMI at age 8 looks completely different from a healthy BMI at 16.
Older adults (65+): Some research suggests a slightly higher BMI (roughly 25–27) may actually be protective in later life, likely because it offers a buffer against illness-related weight loss — though this is still debated in the research community and shouldn’t be self-applied without a doctor’s input.
Pregnant women: BMI categories and healthy weight-gain targets during pregnancy are based on pre-pregnancy BMI, and should be tracked with an obstetrician rather than a general calculator — weight gain during pregnancy is expected and healthy, and isn’t something the standard chart is built to interpret.
The Bottom Line
BMI is a genuinely useful starting point — quick, free, and backed by decades of population health data — but it was never designed to be a complete verdict on any one person’s health, and it’s particularly worth double-checking against Indian-specific cut-offs if that applies to you. Use your number as a prompt to look closer, not as a final answer: pair it with a waist measurement, watch the trend over time rather than a single reading, and bring both to a doctor or clinical nutritionist if your result raises a question you can’t answer alone.
Want a properly personalised read on your number — not just a category, but a plan? I2CAN’s Clinical Nutrition and Dietetics programs are trained on exactly this kind of individualised assessment. Talk to an I2CAN expert →
Frequently Asked Questions
Is BMI the same as body fat percentage?
No. BMI is a weight-to-height ratio that estimates body fat risk at a population level — it doesn’t directly measure fat. Two people with an identical BMI can have very different actual body fat percentages.
What's a "good" BMI for an Indian adult?
Under the Indian consensus guideline, 18.5–22.9 is considered the healthy range, with overweight starting at 23 and obesity at 25 — narrower than the global WHO range of 18.5–24.9. See the full comparison table above.
Can I have a "normal" BMI and still be unhealthy?
Yes — this is common enough to have a name (“thin-fat” or “normal-weight obesity”), where someone has a typical BMI but a higher-than-ideal body fat percentage or visceral fat level. It’s a key reason BMI is best paired with a waist measurement rather than used alone.
How often should I check my BMI?
There’s no fixed rule, but monthly is reasonable for most people actively working on their weight; a few times a year is enough for general monitoring. What matters more than frequency is consistency — same conditions each time, so readings are genuinely comparable.
Is an online BMI calculator accurate?
Yes, for the calculation itself — it’s simple arithmetic, so any correctly built calculator (including the one on this page) will match a manual calculation exactly. Where accuracy varies is in interpretation, which is why category and context matter more than the raw number.